How dynatrace is using devops in Monitoring and Observability?
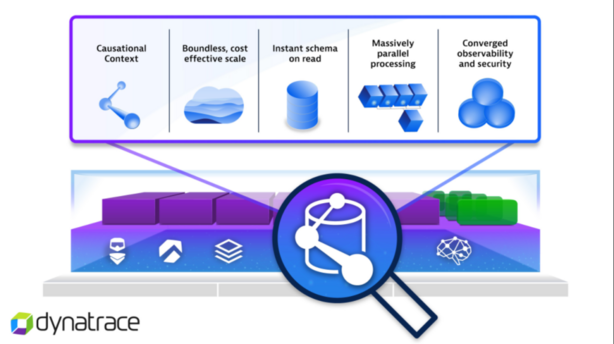
Dynatrace is a powerful software intelligence platform that plays a crucial role in the DevOps lifecycle by providing end-to-end monitoring and observability for applications and infrastructure. It helps DevOps teams monitor system health, track performance metrics, detect anomalies, and deliver seamless user experiences. Through its deep integration with modern DevOps pipelines and cloud environments, Dynatrace empowers teams to continuously improve performance, troubleshoot effectively, and respond to incidents faster.
As DevOps practices focus on automation, collaboration, and continuous delivery, Dynatrace’s monitoring capabilities align perfectly with these goals, allowing organizations to ensure that their applications remain reliable and performant as they scale. This post will explore how Dynatrace leverages DevOps in monitoring and observability, highlighting the major features that make it a valuable tool for DevOps teams.
Key Features of Dynatrace in DevOps Monitoring and Observability
Dynatrace integrates monitoring and observability capabilities into DevOps processes, enabling teams to gain real-time insights into application performance, infrastructure health, and user experiences. By providing visibility into every part of the application lifecycle, Dynatrace enhances collaboration between development, operations, and business teams.
Key Features of Dynatrace:
-
Automatic Full-Stack Monitoring: Dynatrace provides automatic monitoring for everything from infrastructure to applications. It captures detailed data on every transaction, including network, server, database, and application layers.
-
AI-Powered Insights: Through its AI engine, Davis, Dynatrace automatically analyzes all monitoring data to detect anomalies, performance bottlenecks, and potential issues without requiring manual configuration. This reduces alert fatigue and improves response time.
-
Real-Time User Monitoring: Dynatrace allows for real-time monitoring of user interactions, helping teams understand how users experience applications. This enables faster identification and resolution of issues that directly impact user experience.
-
Distributed Tracing: With distributed tracing, Dynatrace tracks every user request across microservices and infrastructure components. This level of visibility helps DevOps teams pinpoint performance issues and optimize complex, multi-tiered environments.
-
Cloud-Native Monitoring: Dynatrace is designed to work seamlessly with cloud environments like AWS, Azure, and Google Cloud. It automatically detects and monitors cloud-based services, containers, and Kubernetes clusters, ensuring teams can track their cloud applications’ health.
How Dynatrace Integrates with DevOps Pipelines
Dynatrace provides real-time observability, which is crucial for DevOps teams to maintain agility, speed, and efficiency. By integrating with CI/CD pipelines, Dynatrace ensures that performance and availability are continuously monitored, even as code is pushed to production.
Integrating Dynatrace with CI/CD Pipelines:
-
Continuous Performance Testing: With Dynatrace integrated into your CI/CD pipeline, performance testing becomes part of the deployment process. This allows teams to detect performance regressions early, ensuring that code changes do not negatively impact system performance or user experience.
-
Automated Monitoring: Dynatrace automatically adjusts its monitoring to match the dynamic nature of DevOps environments. As new services or applications are deployed, Dynatrace detects them and begins monitoring without requiring manual intervention.
-
Pre-deployment Checks: Before code is deployed, Dynatrace allows teams to perform automated checks for performance and scalability. This provides an additional layer of confidence that new releases will not introduce critical issues.
-
Seamless Rollbacks: If performance issues are detected after deployment, Dynatrace helps teams identify the root cause and revert to a previous stable state. This reduces downtime and improves release reliability.
-
Integration with DevOps Tools: Dynatrace integrates with popular DevOps tools like Jenkins, GitLab, CircleCI, and Kubernetes, making it easy to incorporate observability directly into your DevOps workflows.
Real-Time Monitoring and Incident Detection in Dynatrace
Dynatrace provides real-time monitoring of both applications and infrastructure, enabling teams to quickly detect incidents and minimize their impact. This proactive approach is essential for modern DevOps environments where uptime and performance are critical.
Key Aspects of Real-Time Monitoring and Incident Detection:
-
End-to-End Visibility: Dynatrace provides visibility from the front end (user interactions) to the backend (infrastructure), ensuring that any issues, whether they occur on the client side or within the system, are detected immediately.
-
Root Cause Analysis with AI: When an incident occurs, Dynatrace’s AI-driven platform helps teams automatically detect the root cause of the issue, whether it’s related to server performance, database queries, or external service calls.
-
Proactive Alerts: Dynatrace’s AI continuously analyzes performance data and sends proactive alerts when performance deviates from the norm, reducing the noise from unnecessary alerts and ensuring teams focus on the most critical issues.
-
Real-Time Dashboards: Dashboards in Dynatrace offer real-time metrics on system performance, allowing DevOps teams to monitor KPIs such as response times, error rates, and system uptime. This helps in maintaining a clear overview of how systems are performing at any given time.
-
Incident Collaboration: With integrated incident management, Dynatrace supports collaboration between team members during incidents. DevOps teams can share data, trace logs, and update each other on progress in real-time, reducing resolution time.
Improving Continuous Delivery with Dynatrace
Dynatrace’s integration with DevOps enables teams to enhance their continuous delivery pipelines, ensuring that updates are deployed rapidly and reliably without sacrificing performance or quality. By using Dynatrace’s monitoring tools throughout the delivery process, teams can ensure that each deployment is smooth and meets performance expectations.
How Dynatrace Improves Continuous Delivery:
-
Performance Validation in Staging: Before deploying to production, teams can validate performance in staging environments using Dynatrace’s real-time monitoring. This ensures that the performance in production matches expectations, helping to prevent performance regressions.
-
Quality Gates: Dynatrace can be used as a quality gate during the CI/CD process to assess whether code is performing as expected before it is deployed to production. If performance thresholds are not met, code can be automatically rejected or sent back for improvement.
-
Automated Scaling and Monitoring: Dynatrace integrates with cloud-based environments to automatically scale applications based on real-time metrics. It continuously monitors scaling actions to ensure that systems are performing optimally as demand fluctuates.
-
Optimized Rollout Strategies: By monitoring the effects of new deployments on system performance, Dynatrace helps DevOps teams implement optimized rollout strategies, such as canary releases or blue-green deployments, to minimize risk.
-
Rapid Feedback Loops: As part of the DevOps feedback loop, Dynatrace provides rapid insights into the performance of newly deployed features. This enables teams to make quick adjustments to improve user experience or fix issues.
Collaboration Between Teams with Dynatrace
Effective collaboration is a key aspect of DevOps, and Dynatrace supports this by providing tools that allow development, operations, and other teams to share data, monitor performance, and resolve issues together. Dynatrace’s user-friendly dashboards, alerting systems, and automated workflows foster collaboration among team members and stakeholders.
How Dynatrace Facilitates Team Collaboration:
-
Centralized Dashboards: Dynatrace’s centralized dashboards provide all team members with access to the same data, promoting transparency and alignment between development, operations, and business teams.
-
Cross-Team Notifications: Dynatrace’s notification system can alert relevant team members about performance issues or incidents, ensuring that the right people are informed in real-time and can collaborate on resolutions.
-
Automated Incident Response: Dynatrace’s incident management system automates responses to common issues, enabling teams to work more efficiently and reduce manual intervention. This ensures that response times are minimized, and problems are addressed faster.
-
Integration with Collaboration Tools: Dynatrace integrates with communication platforms like Slack and Microsoft Teams, making it easy for teams to discuss issues, share data, and collaborate on resolving incidents without leaving their workflow.
-
Shared Insights for Continuous Improvement: By enabling all teams to access the same performance metrics, Dynatrace fosters a culture of continuous improvement, where feedback can be shared, analyzed, and acted upon quickly to enhance system performance.
Dynatrace’s Impact on DevOps Monitoring and Observability
Dynatrace’s AI-powered, full-stack observability solution significantly enhances DevOps monitoring by providing deep insights into application performance, infrastructure health, and user experience. Through its seamless integration with CI/CD pipelines, real-time monitoring, and advanced incident detection capabilities, Dynatrace empowers teams to detect and resolve issues quickly, automate repetitive tasks, and continuously improve system performance.
By offering end-to-end visibility and fostering collaboration between teams, Dynatrace helps DevOps teams deliver faster, more reliable software while maintaining high service quality. Whether you’re monitoring cloud-native applications, optimizing performance, or managing complex multi-cloud environments, Dynatrace is an essential tool for modern DevOps teams aiming for success.
The post How dynatrace is using devops in Monitoring and Observability? appeared first on Best DevOps.
Go to Source