How to setup monitoring devops?
Monitoring is a critical aspect of DevOps that allows teams to ensure the health, performance, and availability of applications and infrastructure. Effective monitoring helps DevOps teams quickly identify issues, optimize performance, and ensure that software is deployed and delivered efficiently. With the fast-paced and automated nature of DevOps, continuous monitoring ensures that any problems are detected early, allowing for quick remediation.
This post will explore how to set up monitoring in a DevOps environment, detailing the tools and features required for a comprehensive monitoring setup and how these features contribute to the efficiency of DevOps workflows.
Key Metrics to Monitor in DevOps
Setting up effective monitoring in DevOps begins with identifying the right metrics to track. These metrics provide insights into system performance, user experience, and infrastructure health, enabling teams to take proactive measures when issues arise.
Key Metrics for Monitoring:
-
Application Performance Metrics:
-
Response times: How long it takes for the application to respond to user requests.
-
Error rates: The percentage of requests that result in errors, such as 500 errors or database failures.
-
Throughput: The number of transactions handled by the system per unit of time.
-
Latency: Time taken to process requests and deliver data from the server to the user.
-
-
Infrastructure Health Metrics:
-
CPU usage: Tracks how much processing power is being used by servers and applications.
-
Memory usage: Helps determine if the system is running out of memory, which could lead to performance issues.
-
Disk I/O: Monitors the read/write operations on disk storage to ensure smooth data retrieval and storage.
-
Network performance: Measures data transfer speeds, packet loss, and bandwidth usage.
-
-
Deployment Metrics:
-
Deployment frequency: Tracks how often new code is deployed to production, a key indicator of DevOps speed.
-
Mean time to recovery (MTTR): Measures how long it takes to restore service after a failure.
-
Change failure rate: The percentage of deployments that cause failures, which can indicate issues with testing or deployment pipelines.
-
-
User Experience Metrics:
-
Uptime/downtime: Tracks application availability to ensure it meets the Service Level Agreement (SLA) standards.
-
Transaction success rate: The percentage of successful transactions completed without issues, reflecting overall system reliability.
-
Response time under load: Measures how the application behaves under high user demand.
-
Tools for Monitoring in DevOps
To set up an effective monitoring system, teams need the right tools that can collect, analyze, and visualize metrics from various parts of the system. These tools integrate with DevOps pipelines and provide real-time data to help teams optimize performance and address issues quickly.
Popular Monitoring Tools:
-
Prometheus:
-
Open-source monitoring and alerting toolkit widely used for monitoring containerized applications.
-
Provides time-series data and is highly effective for monitoring cloud-native environments and microservices.
-
Integrates seamlessly with Kubernetes and Docker for monitoring container health.
-
-
Grafana:
-
A powerful open-source visualization tool that integrates with Prometheus, Elasticsearch, and other data sources to create interactive dashboards.
-
Enables real-time data visualization, allowing teams to track metrics and performance trends efficiently.
-
-
Datadog:
-
A cloud-based monitoring platform that provides comprehensive visibility into applications, infrastructure, and logs.
-
Offers integrations with various DevOps tools, such as Jenkins, Kubernetes, AWS, and Azure, to provide end-to-end monitoring and observability.
-
-
New Relic:
-
A cloud-based platform that provides real-time insights into application performance, infrastructure health, and end-user experiences.
-
Offers APM (Application Performance Monitoring) and detailed performance analytics for applications and infrastructure.
-
-
ELK Stack (Elasticsearch, Logstash, Kibana):
-
A powerful combination of tools for logging, visualizing, and analyzing logs and metrics from applications and infrastructure.
-
Kibana allows teams to create custom dashboards and visualize data in a user-friendly format.
-
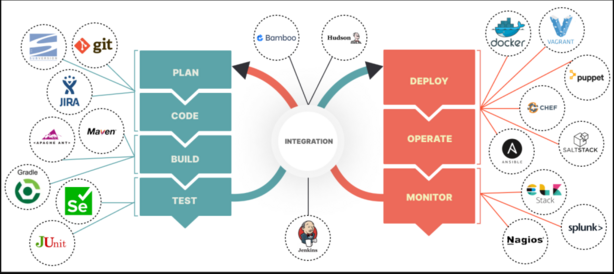
Integrating Monitoring with DevOps Pipelines
In a DevOps environment, monitoring is not just about tracking system health in production; it also plays a crucial role throughout the development lifecycle. By integrating monitoring into your CI/CD pipelines, you ensure that performance and reliability issues are detected early, before code is deployed to production.
Steps to Integrate Monitoring with CI/CD:
-
Automate Monitoring Setup:
- Use tools like Terraform or Ansible to automate the setup and configuration of monitoring systems as part of your infrastructure provisioning. This ensures consistency across environments and reduces manual setup errors.
-
Monitor Code Quality:
- Integrate tools like SonarQube or CodeClimate into your CI/CD pipeline to monitor code quality, ensuring that any issues related to performance or security are detected early.
-
Performance Testing in Staging:
- Automate performance tests in staging environments before deployments to production. Use tools like JMeter or LoadRunner to simulate user traffic and monitor how the application performs under load.
-
Trigger Alerts on Build Failures:
- Integrate your monitoring tool with your CI/CD platform to automatically trigger alerts when build failures or performance regressions are detected. This helps teams address issues before they reach production.
-
Continuous Feedback Loops:
- Use feedback from automated testing, monitoring, and logs to continuously improve code quality. This allows developers and operations teams to identify areas for optimization and make iterative improvements.
Real-Time Alerts and Incident Management
Setting up automated alerts is essential in any DevOps monitoring system. Alerts notify teams in real time when metrics exceed predefined thresholds or when failures occur, enabling quick responses to issues before they affect users.
Best Practices for Alerts and Incident Management:
-
Define Thresholds:
- Set appropriate thresholds for critical metrics, such as CPU usage, memory utilization, error rates, and response times. These thresholds should be based on historical performance data and user expectations.
-
Smart Alerts:
- Use AI and machine learning capabilities in tools like Datadog or Dynatrace to create smart alerts. These tools can automatically detect anomalies and notify teams about potential issues without overwhelming them with false alerts.
-
Escalation Policies:
- Establish clear escalation policies to ensure that alerts are directed to the right team members. For example, application performance issues might escalate to developers, while infrastructure problems might require attention from operations teams.
-
Alert Channels:
- Set up alert notifications through various channels such as email, SMS, Slack, or PagerDuty. This ensures that the right people are notified, no matter where they are.
-
Incident Management:
- Integrate monitoring tools with incident management platforms like Jira or ServiceNow to automatically create tickets and track the resolution process. This ensures incidents are handled promptly and efficiently.
Visualizing Monitoring Data for Better Insights
Visualization is crucial for understanding complex monitoring data and making it accessible to all team members. Dashboards provide an intuitive way to track key metrics, identify trends, and make data-driven decisions.
Key Features of Effective Monitoring Dashboards:
-
Real-Time Data Visualization:
- Use tools like Grafana or Kibana to create interactive, real-time dashboards that provide insights into application performance, infrastructure health, and user experience.
-
Custom Dashboards:
- Create customized dashboards tailored to different stakeholders. Developers might need detailed application performance metrics, while operations teams may focus more on infrastructure metrics.
-
Alerting on Dashboards:
- Integrate alerting directly into your monitoring dashboards. This allows teams to see metrics and alerts in one place, reducing the need to switch between tools.
-
Historical Data Analysis:
- Dashboards should also provide historical data analysis, helping teams to spot trends over time, track performance improvements, and identify recurring issues.
-
Mobile Access:
- Ensure that dashboards are mobile-friendly, so teams can access critical monitoring data from anywhere, especially when dealing with incidents or system performance issues.
The Benefits of Monitoring in DevOps
Setting up effective monitoring in a DevOps environment is critical for ensuring the performance, availability, and reliability of applications and infrastructure. By leveraging the right tools, tracking key metrics, and integrating monitoring into your DevOps workflows, you can automate alerting, improve collaboration, and enhance the overall quality of your software delivery process.
With continuous monitoring and real-time insights, DevOps teams can quickly identify issues, address incidents proactively, and ensure that their applications and infrastructure are always performing at their best. As DevOps practices continue to evolve, integrating monitoring into every step of the development lifecycle will be essential for maintaining high standards of performance and reliability.
The post How to setup monitoring devops? appeared first on Best DevOps.
Go to Source